Wednesday, December 5, 2012

2012- Best Home Sales Year Since 2007

Shown below are a series of charts summarizing the latest single family home sales for Longmeadow, Massachusetts.  These latest results for the January - November 2012 period include both MLS and FSBO transactions and are based upon public information obtained from the Hampden County Registrar of Deeds website.

Highlights
Encouraging home sales results in Longmeadow continued through November following the trend set earlier this yeear...
  • There were 169 home sales in the January - November 2012 period vs. 133 in the year earlier period- a 24% increase (see figure 1 below).
  • The number of home sales in Longmeadow for the latest January - November  period (169) was the highest total since 2007 (see figure 1 below).
  • Home sales in 2012 are positioned to become the highest total since 2007 when the current housing downturn began.
However, further examination of the recent data shows the continuation of some troubling trends…      
  • Median prices appear to have stabilized at ~ $280,000 after reaching a low point in May at ~ $244,000.  The median sales price (6 month trailing average) for November 2012 was $280,000 as compared to $330,000 one year ago (15.2% lower) and $315,000 for all of 2011.  This latest median sales price was 20% lower than the peak reached in September 2007 ($350,000) (see figure 2 below).
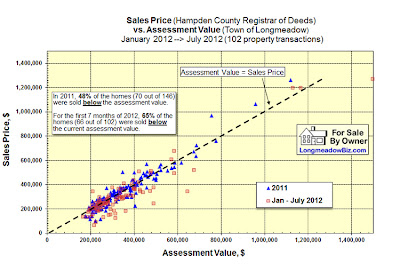
  • For the first 11 months of 2012, 65% of the homes (110 out of 169) were sold below the current assessment value. For the last 3 months (Sept - Nov period), 62% of the homes (30 out of 48) were sold below the current assessment value.  In 2011, 48% of the homes (70 out of 146) were sold below the assessment value (see figure 3 below).
  • So far in 2012 there were only 25 homes (out of 169) that sold at a price of $400K or higher.
Historically low mortgage interest rates and attractive prices continue to help the Longmeadow real estate market gain some momentum with the number of 2012 sales positioned to be highest since 2007. Prices continue to remain soft with the large majority of homes being sold priced less than $400K.

Many r
eal estate markets across the country have shown strength in 2012.  Hopefully, employment will increase and consumer confidence will continue to improve so that the housing market can become more normalized.

________________________________________________________
Figure 1
(click chart to enlarge)


Figure 2
Figure 3


Here is a link to the data for 2006-2012 Real Estate Transactions that were used to develop the above graphs.

LongmeadowBiz.com- Longmeadow's #1 Business and Community website
LongmeadowMA.org- Longmeadow's Newest Community Website

Sunday, September 2, 2012

Encouraging Home Sales Continued in August

Shown below are a series of charts summarizing the latest single family home sales for Longmeadow, Massachusetts.  These latest results from January - August 2012 include both MLS and FSBO transactions and are based upon public information obtained from the Hampden County Registrar of Deeds website.

Highlights

Encouraging results for home sales in Longmeadow continued into August following the trends set earlier this summer...
  • There were 19 home sales in August 2012 vs. 13 in the year earlier period- a 46% increase (see figure 1 below).
  • The number of home sales in Longmeadow for the latest May - August  period (82) was 44% higher as compared to the same period in 2011 (57) and the highest 4 month total since 2007 (see figure 1 below).
However, recent data shows the continuation of some troubling trends observed last month…      
  • Median prices showed a steep decline in the Jan - August 2012 period from corresponding results in 2011. The median sales price (6 month trailing average) for August 2012 was $272,000 as compared to $315,500 one year ago (14% lower) and $315,000 for all of 2011.  This latest median sales price was 22% lower than the peak reached in September 2007 ($350,000).  See figures 2 and 3 below.
  • 14 out of 19 homes sold in August (74%) were at prices below the official assessment value. For the first 8 months of 2012, 66% of the home sold (80 out of 121) were at prices below the official assessment value.  See figure 3 below.
  • Total value of homes sold in July was $5.34 million vs. an assessed value of $5.76 million- a difference of 7.2%.  For the first 8 months of 2012 the total value was $37.0 million vs. $40.6 million for the year earlier period- a difference of 8.9%.
  • In August 2012 there were only 2 homes sold at a price of $400K or higher.
Historically low mortgage interest rates and attractive prices appear to be helping the Longmeadow real estate market gain some momentum.    Many real estate markets across the country have shown similar strength recently.  Hopefully, employment will increase and consumer confidence will soon improve so that the housing market can become more normalized.
_________________________________________
Figure 1- Monthly Home Sales- 2006- 2012


Figure 2: Median Sales Prices
Below is a chart showing the relationship between recent Longmeadow real estate Sales Prices and Assessed Values (data obtained from the Vision Appraisal website).
Figure 3: Sales Price vs. Assessment Value
Here is a link to the data for 2006-2012 Real Estate Transactions that were used to develop the above graphs.

LongmeadowBiz.com- Longmeadow's #1 Business and Community website
LongmeadowMA.org- Longmeadow's Newest Website

Thursday, August 2, 2012

Encouraging July results for Longmeadow home sales

Shown below are a series of charts summarizing the latest single family home sales for Longmeadow, Massachusetts.  These latest results from January - July 2012 include both MLS and FSBO transactions and are based upon public information obtained from the Hampden County Registrar of Deeds website.

Highlights

Encouraging results for home sales in Longmeadow continued into July...
  • There were 22 home sales in July 2012 vs. 15 in the year earlier period- a 47% increase (see figure 1 below).
  • The number of home sales in Longmeadow for the May - July period (63) was 43% higher as compared to the same period in 2011 (44) and the highest 3 month total since 2006 (see figure 1 below).

However, further examination of the recent data shows the continuation of some troubling trends…      
  • Median prices showed a steep decline in the Jan - July 2012 period from corresponding results in 2011. The median sales price (6 month trailing average) for July 2012 was $265,000 as compared to $320,000 one year ago (17% lower) and $315,000 for all of 2011.  This latest median sales price was 24% lower than the peak reached in September 2007 ($350,000).  See figures 2 and 3 below.
  • ~65% of the homes sold (66 out of 102) for 2012 YTD were at prices below the official assessment value- see figure 3 below. For the past 3 years a large percentage of homes (~50%) were sold at prices below the official assessment value.
  • Total value of homes sold in July was $7.03 million vs. an assessed value of $7.35 million- a difference of 4.3%.  For the first 7 months of 2012 the total value was $31.6 million vs. $34.8 million for the year earlier period- a difference of 9.1%.
  • In July 2012 there was only 1 home sold at a price of $400K or higher.
Historically low mortgage interest rates and attractive prices appear to be helping the Longmeadow real estate market gain some momentum.    Many real estate markets across the country have shown similar strength recently.  Hopefully, employment will increase and consumer confidence will soon improve so that the housing market can become more normalized.

 Figure 1 [click chart to enlarge]

Figure 2- Median Sales Prices


Figure 3- Sales Price vs. Assessed Value

Here is a link to the data for 2006-2012 Real Estate Transactions that were used to develop the above graphs.

LongmeadowBiz.com- Longmeadow's #1 Business and Community website
LongmeadowMA.org- Longmeadow's Newest Website

Monday, July 2, 2012

Longmeadow Real Estate- some bright spots are emerging...

Shown below are a series of charts summarizing the latest single family home sales for Longmeadow, Massachusetts.  These latest results from January - June 2012 include both MLS and FSBO transactions and are based upon public information obtained from the Hampden County Registrar of Deeds website.

Highlights
  • There were 25 home sales in June 2012 vs. 17 in the year earlier period- a 32% increase.  A comparison of the first 6 months of 2012 to the year earlier period shows 80 vs. 71- a 13% increase (see figure 1 below).
  • Sales for the first 6 months of 2012 were the best since 2007 which was the beginning of the real estate market collapse.  Most of this improvement was due to the high number of homes sold in June (25).
  • In June 2012 there were 5 homes sales at prices of $500K or higher and 2 homes > $1,000,000 reversing an earlier trend that found only 2 homes sales at prices of $500K or higher for the January - May 2012 period.
 Further examination of the recent data shows the continuation of some troubling trends…      
  • Median prices showed a steep decline in the Jan - June 2012 period from corresponding results in 2011. The median sales price (6 month trailing average) for June 2012 was $259,600 as compared to $310,000 one year ago (16% lower) and $315,000 for all of 2011.  This latest median sales price was 26% lower than the peak reached in September 2007 ($350,000).  See figures 2 and 3 below.
  • ~68% of the homes sold (54 out of 80) were at prices below the official assessment value- see figure 4 below. For the past 3 years a large percentage of homes (~50%) were sold at prices below the official assessment value.
  • The latest data also show some distress sales with 8 transactions involving bank ownership (foreclosure/ short sales) and a number of estate related sales.
Even with historically low mortgage interest rates and attractive prices, selling a home in the current environment continues to be very difficult.  Hopefully, the latest home sales data is pointing to a bottoming process for Longmeadow real estate and the road ahead will be brighter.
 ___________________________________________________
Figure 1- Longmeadow Home Sales


Figure 2- Median Sales Price (6 month trailing avg.)

Figure 3- Median Sales Price (Annual)
Figure 4- Sales Price vs. Assessment Value

Here is a link to the data for 2006-2012 Real Estate Transactions that were used to develop the above graphs.

LongmeadowBiz.com- Longmeadow's #1 Business and Community website
LongmeadowMA.org- Longmeadow's Newest Website

Monday, June 4, 2012

2012 Shows Disappointing Home Sales So Far

2012 has been a difficult time so far to sell a home in Longmeadow….

Shown below are a series of charts summarizing the latest single family home sales for Longmeadow, Massachusetts.  These latest results from January - May 2012 include both MLS and FSBO transactions and are based upon public information obtained from the Hampden County Registrar of Deeds website.

Highlights
A quick review of home sales for the first five months of 2012 shows that home sales were slightly higher (55) vs. the corresponding period in 2011 (54) and slightly lower (-6%) vs. the 7 year average (see figure 1 below).

However, a more thorough examination of the recent data shows troubling trends…       
  • Median prices showed a steep decline in the Jan - May 2012 period from corresponding results in 2011. The median sales price (6 month trailing average) in May 2012 was $244,100 as compared to $302,500 one year ago (19% lower) and $315,000 for all of 2011.  This latest median sales price was 30% lower than the peak reached in September 2007 ($350,000) and the lowest level reached in the past 7 years.  See figures 2 and 3 below for details.
  • ~75% of the homes sold (41 out of 55) were at prices below the official assessment value- see figure 4 below. For the past 3 years a large percentage of homes (~50%) were sold at prices below the official assessment value.  The latest data shows a significant increase in this result (~75%).

  • The latest data also show some distress sales with 6 transactions involving bank ownership (foreclosure/ short sales) and a number of estate related sales.  One foreclosure sale on Ardsley Road was priced at almost $300K below the official assessment value. 10 properties (out of 55) were sold at prices more than $100K below the official assessment value.

  • For the January - May 2012 period there were only two homes sales at prices of $500K or higher.
For the past 4 years home sales prices have shown a seasonal cycle with prices strengthening during the summer months when demand for homes typically increases.  Hopefully, 2012 results will show a similar trend.
Longmeadow property taxes continue to increase at a rapid pace.


FY2012 property taxes increased an average of +5.4% from FY2011 and FY2013 property taxes are projected to increase another 5.8% over FY2012.  A large portion of these tax increases is due to the building of the new Longmeadow High School.  The combination of a poor economy/ jobs picture and the potential need for additional infrastructure improvements (new DPW facility, roads/sewer repair, renovation of the two middle schools, etc.) looming in the future is likely having a dampening effect on Longmeadow home sales.

Selling a home in the current environment continues to be very difficult.  Hopefully, the latest home sales data is pointing to a bottoming process for Longmeadow real estate and the road ahead will be brighter.

Figure 1- Longmeadow Monthly Home Sales[click chart to enlarge]


Figure 2- Median Sales Prices

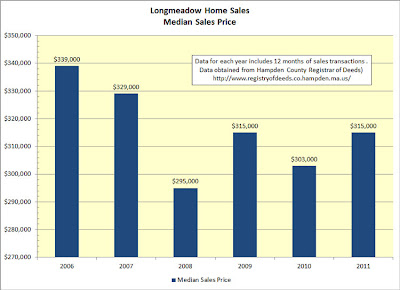
Figure 3- Annual Median Sales Prices


Figure 4- Home Sales Price vs. Assessment Value

Here is a link to the data for 2006-2012 Real Estate Transactions that were used to develop the above graphs.

LongmeadowBiz.com- Longmeadow's #1 Business and Community website
LongmeadowMA.org- Longmeadow's Newest Website

Monday, January 2, 2012

2011 Longmeadow Home Sales

Shown below are a series of charts summarizing the latest single family home sales in Longmeadow, Massachusetts.  These latest results from January - December 2011 include both MLS and FSBO transactions and are based upon public information obtained from the Hampden County Registrar of Deeds website.

2011 Highlights
  • Home sales in Longmeadow in 2011 were lower than 2010 (-7.6% - 146 vs. 158) and also lower (-13.6%) vs. the 6 year average (146 vs. 169)- see figure 1.  Sales in 2011 were also the lowest for the past six years.

    One positive trend... sales in the last three months of 2011 (October --> December) were significantly higher (+35.5%) vs. the corresponding period in 2010 (42 vs. 31).

    With a typical inventory (MLS + FSBO) of ~100-120 homes for sale, the average time to sell a home is ~ 9-10 months.

  • Monthly median sales prices were very volatile in 2011 ranging from a low of $263,800 in April to a high of $331,000 in October.  After a precipitous drop in the 1Q/2011, median prices improved dramatically and stabilized by the end of the year. 

    The median sales price for homes in Longmeadow at the end of 2011 was 5.0% higher ($327,500) as compared to that for the December 2010 ($312,000) - see figure 2.

    Looking at the annual (vs. monthly) variation in median sales price also showed a positive trend.  2011 was 4.0% higher than 2010 but 7.1% lower vs. the peak in 2006- see figure 3.

    For the past 4 years home sales prices have shown a seasonal cycle with prices strengthening during the summer months when demand for homes typically increases.  2011 results showed a similar trend.

  • A large percentage of homes continue to be sold at prices below the official assessment value continuing a trend that has been observed for the past 3 years.  For 2010 and 2011, ~ 50% of the homes sold were at prices below the official assessment value- see figure 4 below.

    Note: Figure 4 uses assessment values as of January 1, 2012.
Selling a home in the current environment continues to be difficult but 2012 is looking better with continuing low interest rates and an improving economy. 
___________________________________________

Figure 1- Longmeadow Home Sales (click chart to enlarge)
Figure 2- Median Sales Prices (Monthly)

Figure 3- Median Sales Prices (Annual)
Figure 4- Sales Prices vs. Assessment Value
Here is a link to the data for 2006-2011 Real Estate Transactions that were used to develop the above graphs.

LongmeadowBiz.com- Longmeadow's #1 Business and Community website
LongmeadowMA.org- Longmeadow's Newest Website